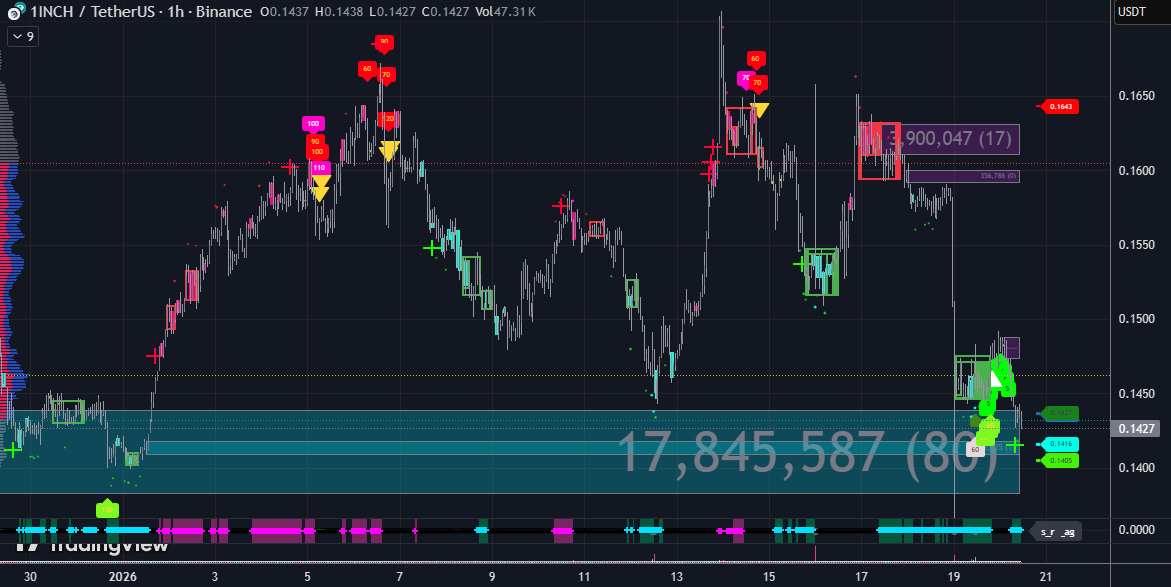
The script automatically detects support and resistance areas on any instrument and across all timeframes. A zone appears on the chart as soon as it is formed and remains visible until a confirmed breakout occurs — defined as a candle on the current timeframe closing outside the zone’s boundaries. Once a breakout is confirmed, the zone is removed automatically.
For each zone, the following information is shown:
- the volume traded within the zone;
- the number of times price has touched the zone.
These metrics can be used to evaluate the reliability of a zone. In addition, the relative “strength” of zones is visually indicated by how long they persist and by their vertical size (price range).
By default:
- resistance zones are highlighted with a purple background;
- support zones are highlighted with a light blue background.
The script includes flexible customization settings, allowing you to adjust:
- zone colors;
- the number of zones displayed;
- the maximum allowed distance of zones from the current price.
The script is distributed in a private-only format and is intended solely for visual market structure analysis.
It does not constitute a trading strategy and does not offer investment advice.
Invite-Only Script
Price:
Monthly: $25 per month
Annual: $240 per year (20% discount)
How to get access:
- Make a payment in cryptocurrency.
- After payment, send a transaction HASH and screenshot.
- You will then receive an invitation to use the script on TradingView.
Please send payment to one of the wallets below:
- USDT (Arbitrum): Loading..
- USDT (Base): Loading..
- USDT (Polygon): Loading..
- USDT / USDC (ERC-20 / Ethereum): Loading…
- USDT (TRC-20 / Tron): Loading…