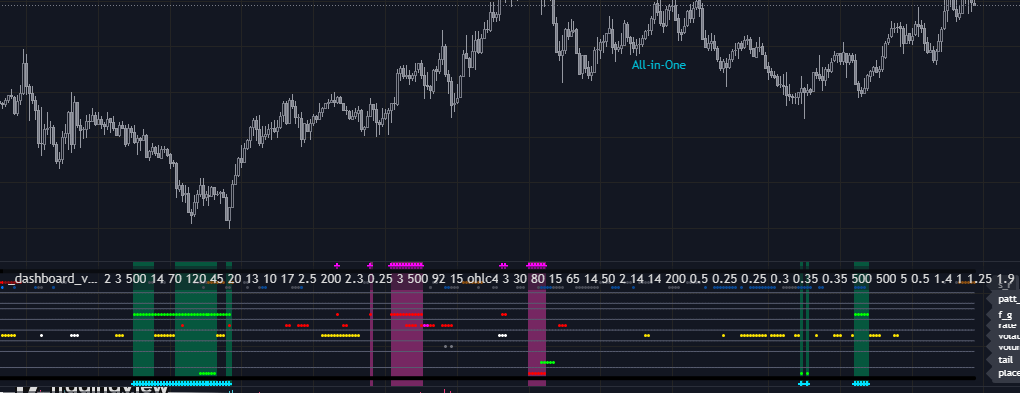
This indicator is a decision-support dashboard designed to assist traders in market analysis. It aggregates multiple key metrics that may influence cryptocurrency price behavior and presents them in a structured, easy-to-read format. Each row of the dashboard reflects the current state of a specific market factor.
The indicator includes, but is not limited to, the following data:
- Funding rate information
- Crypto Fear & Greed Index
- Current market volatility
- Proximity to key support and resistance levels
- Trading volume activity
- Real-time candlestick pattern detection
- Recent liquidation events
- Overbought and oversold conditions of the observed asset
Each of these factors can provide contextual insight into potential market bias and price behavior. When analyzed together within a single interface, they help form a more comprehensive market overview.
When multiple factors align and suggest a bullish market environment, the dashboard background automatically highlights in green, indicating increased upward momentum potential.
Conversely, when the majority of factors point toward bearish conditions, the background shifts to purple, reflecting elevated downside risk.
This script is intended for analytical and informational purposes only and is designed to complement, not replace, independent market analysis and risk management.
Invite-Only Script
Price:
Monthly: $25 per month
Annual: $240 per year (20% discount)
How to get access:
- Make a payment in cryptocurrency.
- After payment, send a transaction HASH and screenshot.
- You will then receive an invitation to use the script on TradingView.
Please send payment to one of the wallets below:
- USDT (Arbitrum): Loading..
- USDT (Base): Loading..
- USDT (Polygon): Loading..
- USDT / USDC (ERC-20 / Ethereum): Loading…
- USDT (TRC-20 / Tron): Loading…